Debugging and Inspection
Debugging with agents
For many debugging tasks, the fastest path is to use an agent that already knows the
@data-client/react debugging workflow.
Install the data-client-react skill
in your coding agent, then ask it to inspect the current page or app state.
How agent debugging works
In dev mode, DevToolsManager exposes live Controller instances so an agent can inspect
cache state, endpoint metadata, and dispatched actions directly from the running app.
Technically, those controllers are stored on globalThis.__DC_CONTROLLERS__, which is a
browser-global Map. You can think of it as a temporary dev-mode registry that lets tools
and agents look up the active DataProvider stores for the current page.
At a high level, the agent can:
- discover the active
DataProvidercontrollers - read normalized or denormalized cache state
- inspect recent fetches, responses, errors, and invalidations
- correlate store changes with browser network activity
- trigger safe controller operations like invalidation or expiration for investigation
This is useful when you want a quick answer to questions like "why didn't this refetch?", "what is in the cache right now?", or "which action updated this entity?" without manually clicking through each inspector panel.
Manual debugging
If you prefer to inspect everything yourself, the browser devtools workflow below remains the standard manual path.
Installation
Add the browser extension for chrome extension or firefox extension
Open dev tools


After installing and loading your site in dev-mode, you either click the Data Client logo (default bottom-right of window) or the redux-devtool logo in the location bar.
Clicking that will open the inspector, which allows you to observe dispatched actions, their effect on the store's state as well as current store state.
The Data Client logo only appears in dev-mode. However, its location can be moved or completely disabled by setting the devButton DataProvider prop.

The Controller dispatches actions, making that page useful for understanding what actions you see. Here we observe common actions of fetch and setResponse.
By default the devtool integration will filter duplicate fetch actions. This can be changed with skipLogging option.
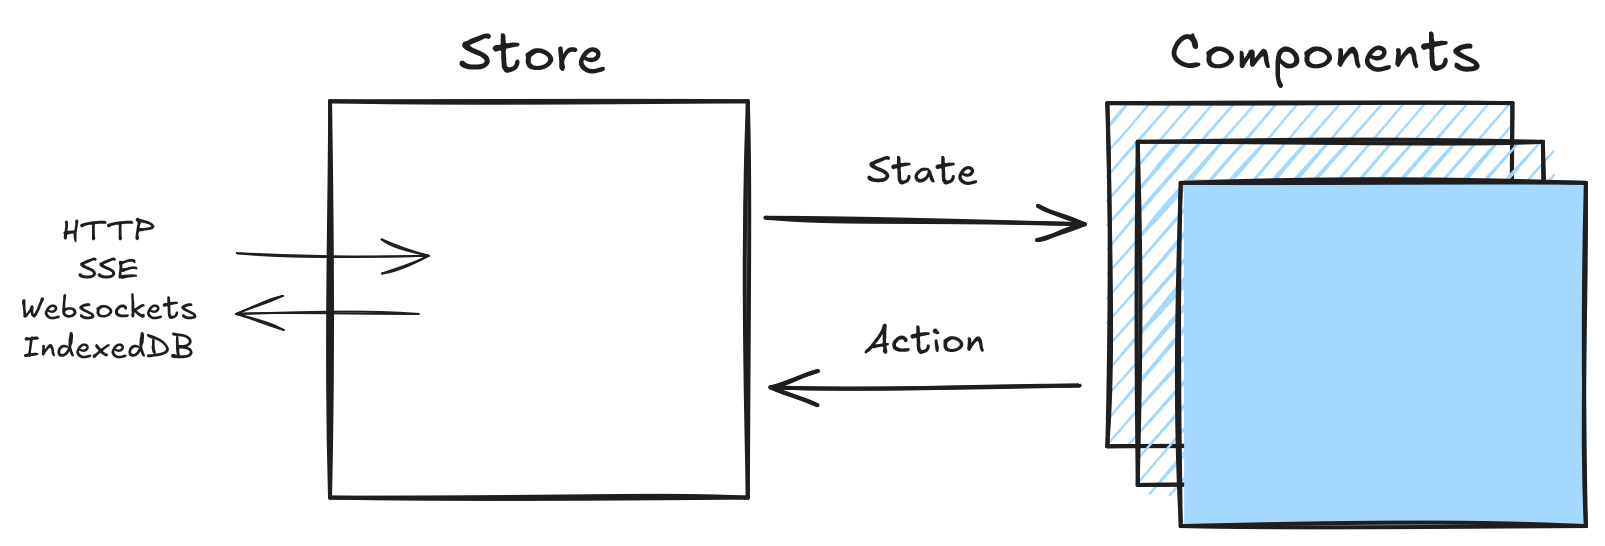
Control flow
Data Client uses the flux store pattern, making debugging straightforward as each change is traceable and descriptive.
State Inspection
Whens schemas are used, responses are normalized into entities
and endpoints tables. This enables automatic performance advantages over simpler key-value fetch caches; especially
beneficial with dynamic (changing) data. This also eliminates data-inconsistency bugs.

Click on the 'state' tab in devtools to see the store's entire state. This can be useful to determine exactly where data is. There is also a 'meta' section of the cache for information like when the request took place (useful for TTL).
State Diff
For monitoring a particular fetch response, it might be more useful to see how the store updates. Click on the 'Diff' tab to see what changed.

Here we toggled the 'completed' status of a todo using an optimistic update.
Action Tracing
Tracing is not enabled by default as it is very computationally expensive. However, it can be very useful
in tracking down where actions are dispatched from. Customize DevToolsManager
by setting the trace option to true with getDefaultManagers:
import {
  DevToolsManager,
  DataProvider,
  getDefaultManagers,
} from '@data-client/react';
import ReactDOM from 'react-dom';

const managers = getDefaultManagers({
  devToolsManager: { trace: true },
});

ReactDOM.createRoot(document.body).render(
  <DataProvider managers={managers}>
    <App />
  </DataProvider>,
);